One of the features in Asternic Scripter is a phone based template, that can be used to perform automated phone based surveys integrated with your Asterisk based PBX. You can use this powerful feature to perform a customer satisfaction survey automatically to the caller after the agent hangs up the call, by using the ‘Queue Continue' configuration in your Issabel PBX. You can then use the builtin Scripter storage to view results, or perform a visual integration with Asternic Call Center Stats so you can see performance/metrics and recordings all together in Asternic Call Center reports.
This tutorial will cover:
- Creation of a phone based customer satisfaction survey
- How to integrate surveys with Issabel
- Overview of builtin storage engine to see results
- Asternic Call Center Stats PRO integration for showing results
We will use the scripter to create a special phone script to perform the customer satifsfaction survey.
This survey will prompt the callers to rate agent performance and overall satisfaction on a scale of 1 to 5, being one the lower score and 5 the highest one.
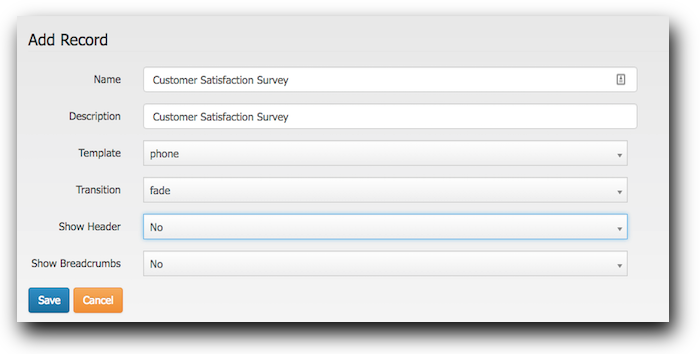
Let's start by creating a new Script of type phone:
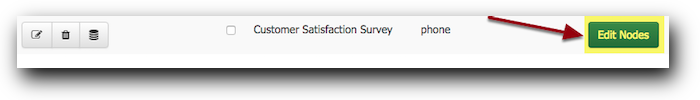
Once created, click the Edit Nodes button to start creating the actual script questions
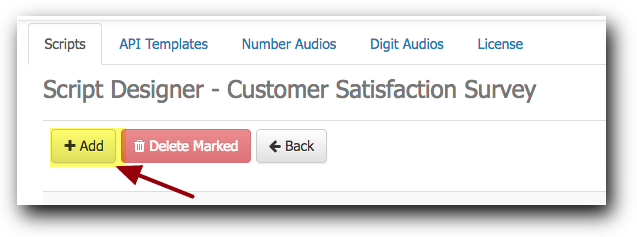
Once inside the node editing screen, click the Add button to create our first node:
The node creation form will open up:
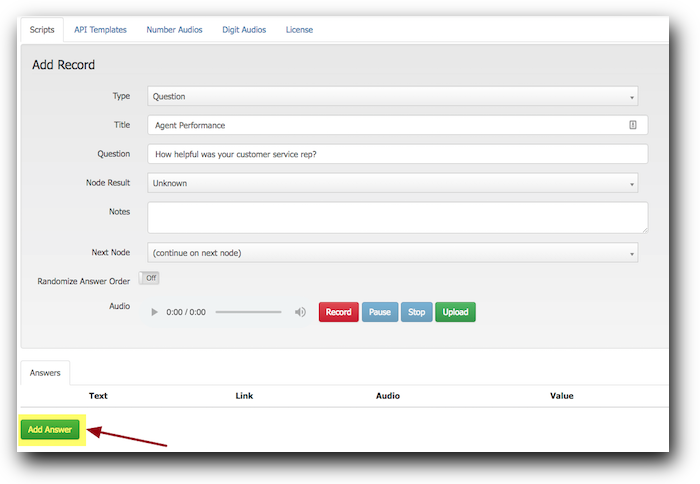
Fill the title and questions as shown. Select the "Question" type as we will prompt the user to enter data, and then set a Title and Question fields. The Question field is indicative. The Title field will be used as a database field when storing results, so be sure to select a relevant title for the information you intend to gather in the survey. Use a descriptive title, and think of it as a field name.
We want to add the available responses the customer might enter via their phone, so we click the "Add Answer" button 5 times, as we want to let the user enter responses on a scale from 1 to 5. After the 5 entries appear, we will need to fill the proper values. Text field is indicative, you can use it to write the voice prompt used for the option. Value is the actual value that will be saved in the datastore. It should look like this when completed:
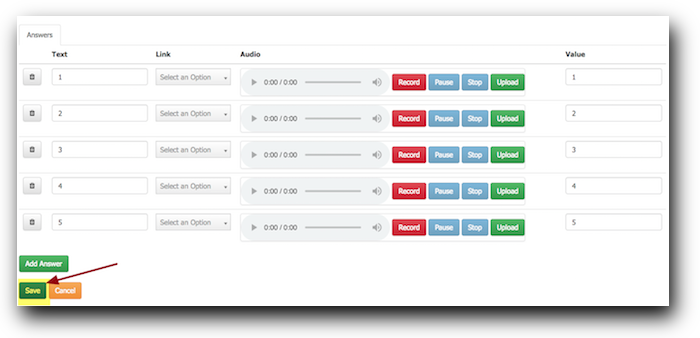
Press Save to store the node.
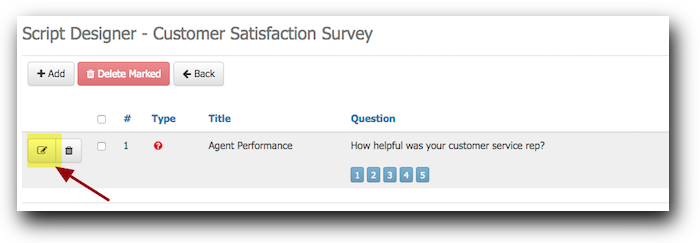
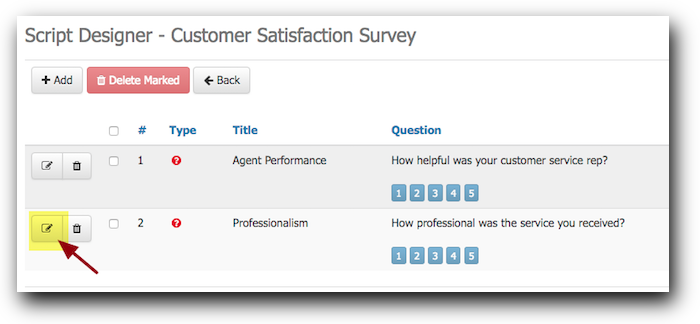
Once the node is saved in the database, we will be able to record or upload audio prompts into it (we cannot record the prompts before the node is stored, that is why you must first save it and then edit to upload or record). So click the Edit button on the node:
You can now either upload or record the question directly from your browser by clicking the Record button.
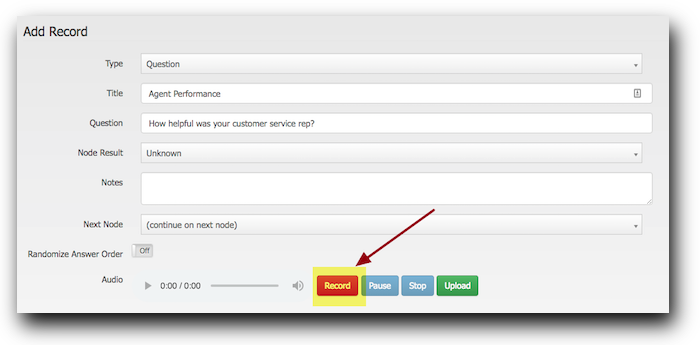
Once you do just speak the question aloud into your computer microphone: "On a scale of 1 to 5, being 1 not helpful at all and 5 extremelyl helpful, how would you rate your customer service representative?"
You can then review your recording by clicking the play icon, if you are not satisfied you can record as many times as needed, or just upload a pre recorded prompt.
To complete the node, press Save.
It's time to create the second question/node. Click the Add button and coplete the node creation form as shown:
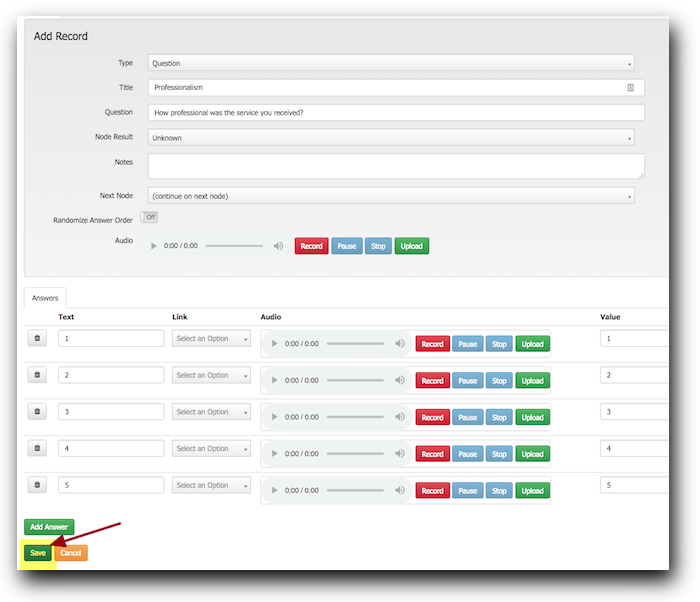
Again we select the Question type. This time we will ask about professionalism of the service rep. We add the 5 possible answers with values from 1 to 5, just like we did with the first question. When done, click Save.
Now that the node is saved, we need to edit it to upload or record the corresponding voice prompt, so click the Edit button on the node:
Once inside the node, click the Record button:
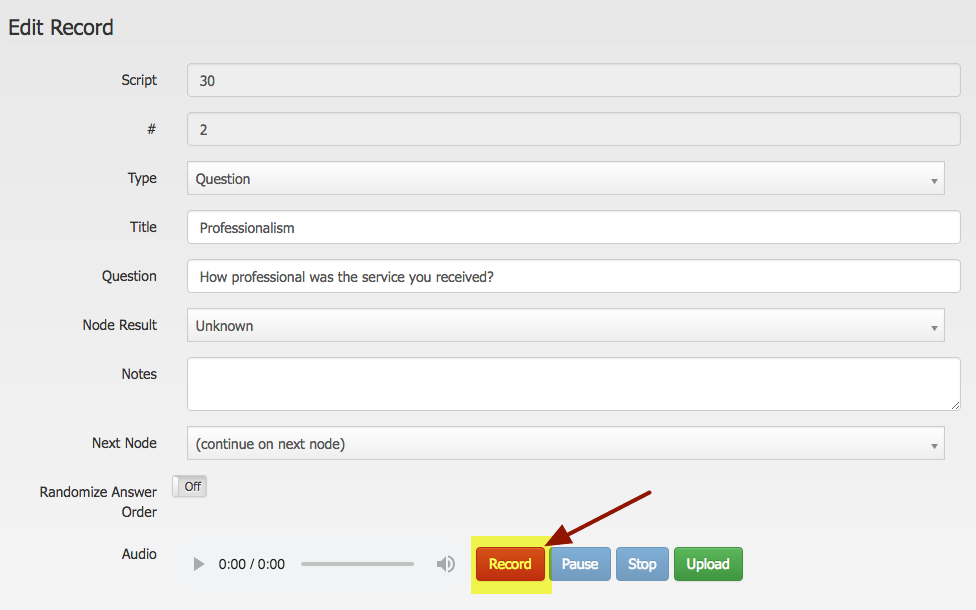
And record your question: "On a scale of 1 to 5, being 1 not professional at all and 5 extremely professional, how would you rate your customer service representative?"
You can then review your recording by clicking the play icon, if you are not satisfied you can record as many times as needed, or just upload a pre recorded prompt.
To complete the node, press Save.
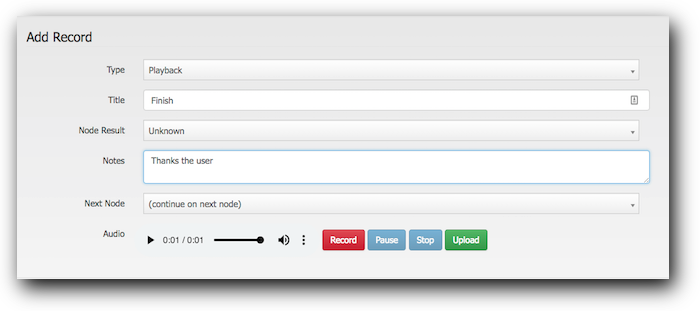
We have completed the questions. The last step would be to create a node to just thank the user for completing the survey. It would not be polite to just hangup the call once the last question is answerd, isn't it?
So, create a new node of type Playback and record a prompt thanking the user, something like "Thank you for your feedback"
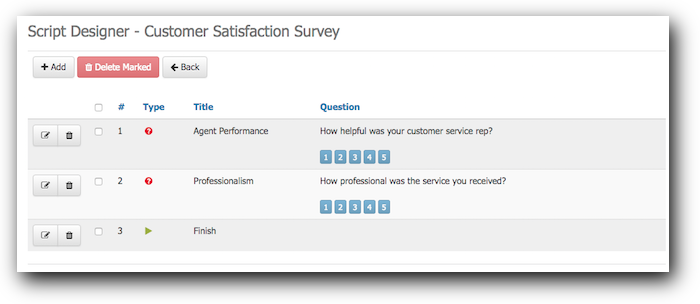
When done, click the Save button. Your script will look like this once its done:
The survey is now completed. In order to get it ready for integration, be sure to reload the panel via the panel manager Action menú:
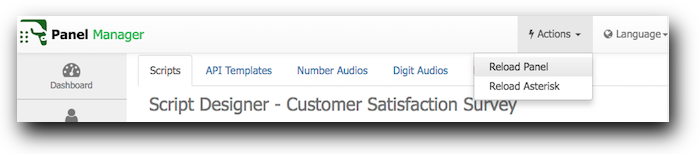
This is needed for the dialplan to be created. You are now ready to integrate the survey in your Issabel queues.
Once we have the survey, we want to use it in our Issabel dialplan. This is really simple to do, as the Scripter will create a custom destination that we can use from Issabel configurations to go to the survey in question.
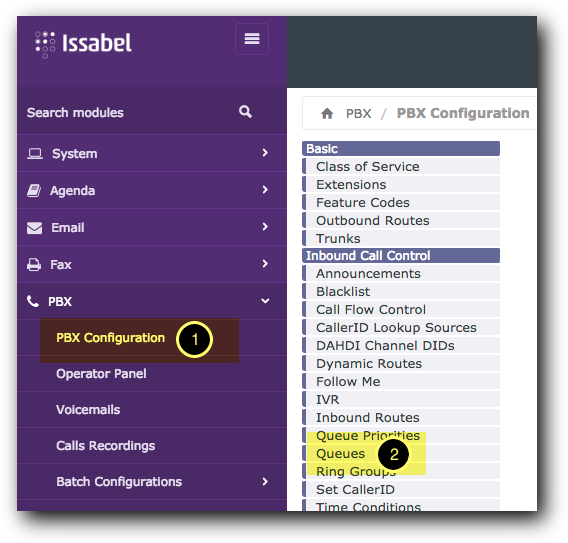
For this particular case, we want to send customers directly to the survey once a queue call is finished. So, we need to log into Issabel, go to (1) PBX Configuration and select the (2) Queues menu inside "Inbound Call Control"
We will edit an existing queue or create a new one. All of the queue options like agents avaialble, ring strategies or timeouts are not covered in this tutorial. But we will point out the feature we need to use to direct callers to a survey automatically once the agent hangs up. Scroll down near the end of the queue editing page and you will find the "Queue Continue Destination" menú, where you will be able to select the Survey we have just created:
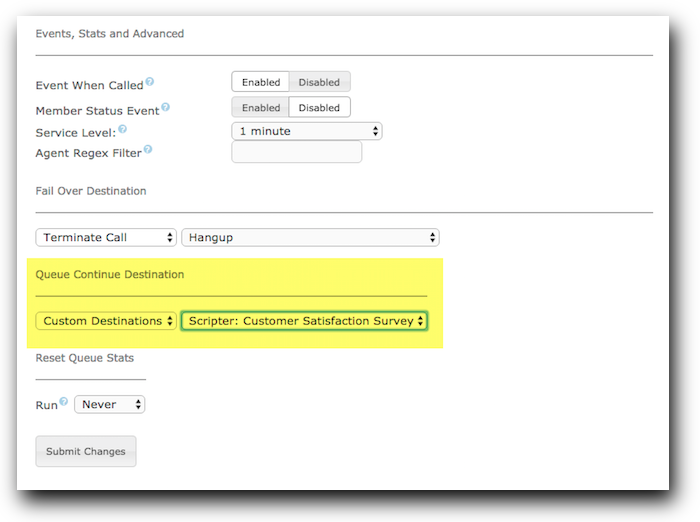
After selecting it, click on Submit Changes are you are done! Whenever a caller is connected to an agent on that queue, and after the agent hangs up, the caller will be directed to the survey.
Once the survey is done and configured as a post call destination inside a queue, every caller will be directed to the survey and they will start either responding to them or perhaps hanging up before giving any answer.
Results for the survey will be saved by default in the Scripter datastore. Click on the Saved Data icon on the script list page to open it up:
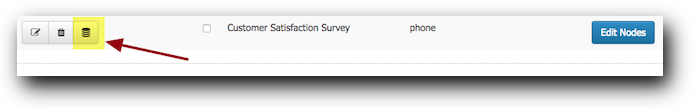
Once clicked, the datastore will appear showing all results for that particular survey:
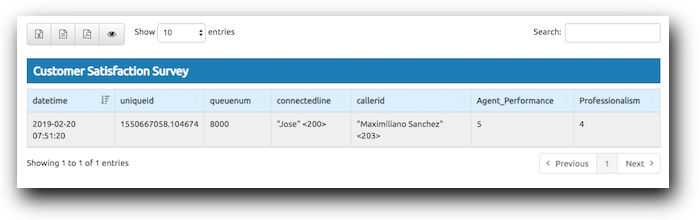
You can review results there and export the data/information to PDF, Excel or CSV using the toolbar buttons.
If you also have Asternic Call Center Stats PRO, you can relate this results to other queue metrics data, including links to recordings that will let you review the call and assess why a customer might not be happy. Asternic integration will be discussed in the next steps.
If you use Asternic Call Center Stats PRO, you can integrate survey results to your regular queue metrics and reports by using the Report Designer feature on CCStats PRO, this will let you analize survey data in a contextualized way, including access to call recordings. This customizations will allow you to have detailed info like this:
Granting MariaDB/MySQL permissions to the asterisk database
Asternic uses its own database and user/pass combination for the statistical data, while the scripter runs alongside FOP2 that usually stores its data and tables into the ‘asterisk' database or ‘fop2' database if not using Issabel or FreePBX. In either case, you should be sure your database user is allowed to access data outside the ‘qstats' database. So, asuming you installed everything with default users and passwords, you will need to run the following query in MySQL/MariaDB, from the command line run this (you must know your MySQL root password as you will be prompted for it):
mysql -u root -p -e "GRANT select ON asterisk.* to qstatsUser@'localhost' identified by 'qstatsPassw0rd'"
Getting the Scripter ID number
Our objective is to link the scripter table data with Asternic table data so we can use it in its reports. For doing that we must know the table name where the scripter stores the survey information.
Perhaps you noticed that when editing a node there is a Script ID field that is shown, but cannot be modified. Go ahead, edit one of the script nodes and look at the Script number:
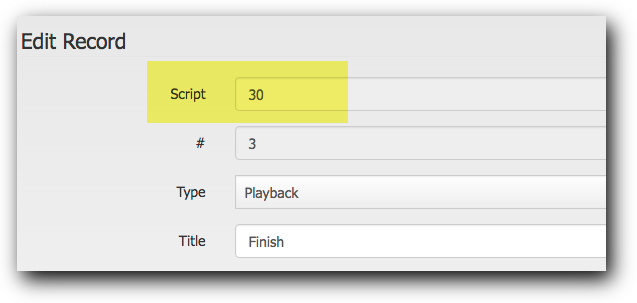
Take into account that he script number in your case will not be the same as shown above, as it depends on your own installation and the number of scripts you had created already.
Scripter tables are stored -most probably- in the ‘asterisk' database in a table with a name construct like "scriptersaveddata_XX" where XX is the script number.
So, assuming our script number is 30, like the picture above, we will need to join Asternic tables with the Scripter asterisk.scriptersaveddata_30 table.
Joining data with Asternic CCStats Pro
We now know the table name for the scripter data: "asterisk.screiptersaveddata_30". We will be using the Report Designer tool in Asternic Call Center Stats PRO
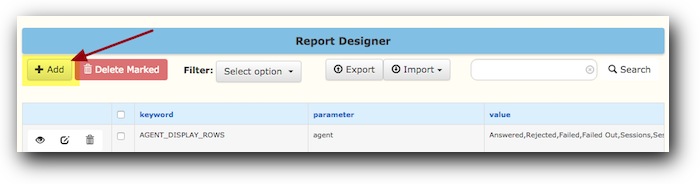
For doing so, we must log into as an admin user, and open Setup / Report Designer from the top menu. Once there we need to add a new entry by clicking the Add button:
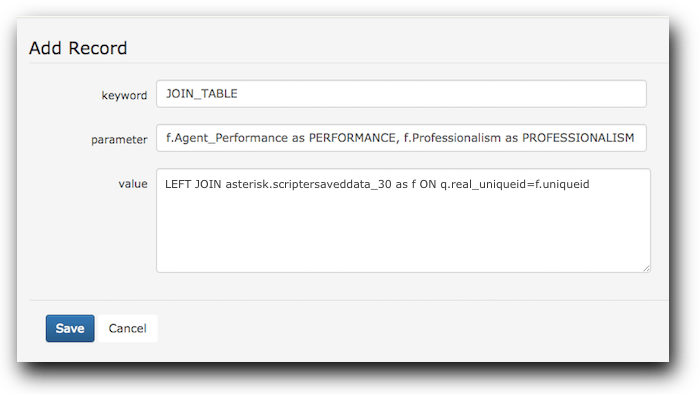
In order to join data, we use the JOIN_TABLE keyword. In the parameter field we must fill the fields we want to gather from the linked table, and in the value field we must write the join condition for our query, like this:
keyword | JOIN_TABLE |
parameter | f.Agent_Performance as PERFORMANCE, f.Professionalism as PROFESSIONALISM, IF(f.Agent_Performance<>'',1,0) as PERFCOMPLETE, IF(f.Professionalism<>'',1,0) as PROFCOMPLETE |
value | LEFT JOIN asterisk.scriptersaveddata_30 as f ON q.uniqueid=f.uniqueid |
The form will look similar to this (note that long fields won't be displayed fully as the above).
Note that we relate/link records using a left join and the Asterisk uniqueid field. The actual scripter field names can be seen in the datastore reviewer in the previous step, or inspecting table structures directly. Be very careful if you later modify a script, as changing a title on a question node will also change the field names on the results table, so you will need to modify Asternic CCStats PRO join_table also.
We are also adding two extra conditional fields that we will be using to compute averages: PERFCOMPLETE and PROFCOMPLETE. This is done because we do not want to average calls that did not answer the survey, they will take the numbers way down on reports (like answering ZERO on questions). Those two fields will add 1 if the question was answered, so we can use that field to perform the average calculation later on.
Defining Survey Data Columns
With the above setup, you will have two new custom fields at your disposal for showing on reports: PERFORMANCE and PROFESSIONALISM. We use uppercase for clarity and consistency, although it is not mandatory to use uppercase on the SQL queries, in designer lingo, variables are represented in uppercase, and those fields will become variables to be used in formulas on the next steps.
Asternic organices reports on 3 main categories that are shown in independent tabs: Answered, Unanswered and Distribution. Answered will group all calls that were connected to an Agent, Unanswered will show all calls that were not connected to any agent, and Distribution will mix both Answered and Unanswered and group them mostly by periods of time, queues, etc. For tutorial brevity we will focus on the Answered category. You could replicate the steps on the other categories by just changing ANSWERED to DISTRIBUTION where it corresponds. In this case were the survey is presented to the caller after the agent hangs up, there is no point in adding data in the UNANSWERED section, as no unanswered call will have a link to a completed survey ever.
So, we need now to enumerate the new fields on report columns. In order to do we must add two new entries in Report Designer, one for each field for the Answered reports. The keyword to use in this case is COLUMN_ANSWERED, the parameter is the table field name, and the value is the formula to use to display the results on reports. They should look like this:
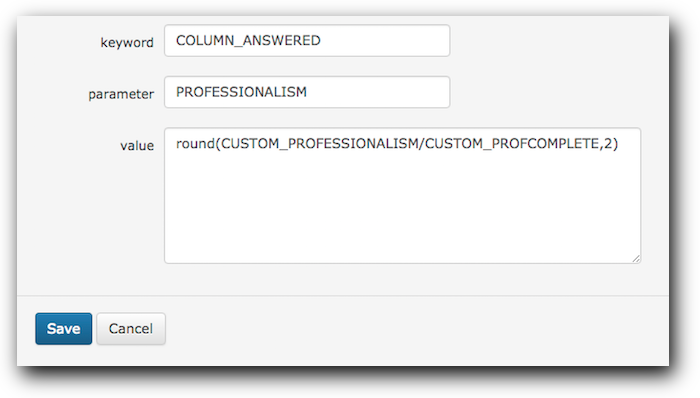
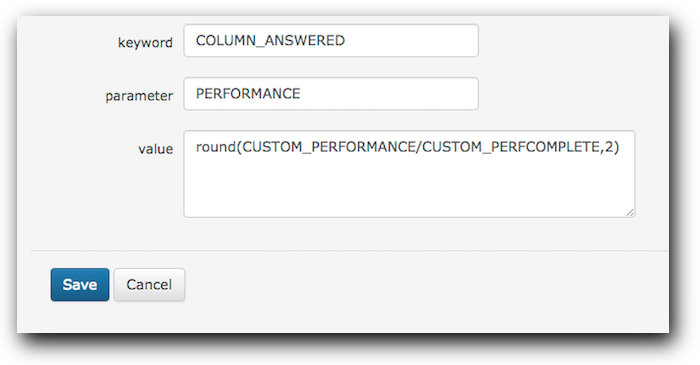
Notice that custom variables in formulas will be named CUSTOM_(FIELDNAME). Note also that we use the Round function and perform an average by dividing on CUSTOM_PERFCOMPLETE or CUSTOM_PROFCOMPLETE , as we want to display a rating average on the grouped results instead of a SUM (the default behavior if we just use the CUSTOM_VARIABLE in the formula). Remember we defined in the JOIN_TABLE this two additional and conditional fields that will output a 1 when the field is populated and a 0 when not, so we can average on actual responses and not on the total of received calls.
If you want to add the information to Distribution tabs, you must create additional fields with keyword COLUMN_DISTRIBUTION with the same parameter and value.
Adding survey results into existing reports
We have joined the data, defined the new columns, now we must decide on which reports we want to actually show those columns. For doing so we must modify/edit the ANSWERED_DISPLAY_ROWS entries. You can filter/search on designer for ANSWERED_DISPLAY_ROWS:
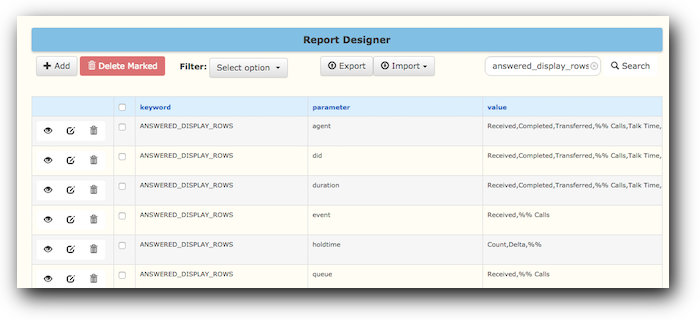
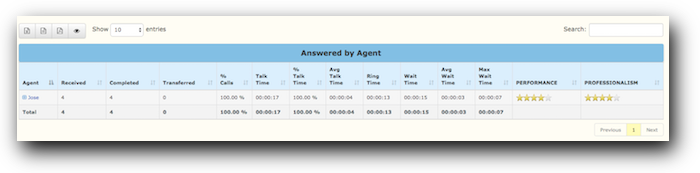
There are several entries showing, one for each report on the category. The actual report/field to use for grouping data is stored in the parameter field. So if we want to add two new columns to the "Answered by Agent" report in Asternic, we must edit the ANSWERED_DISPLAY_ROWS for "agent" and add our new fields there:
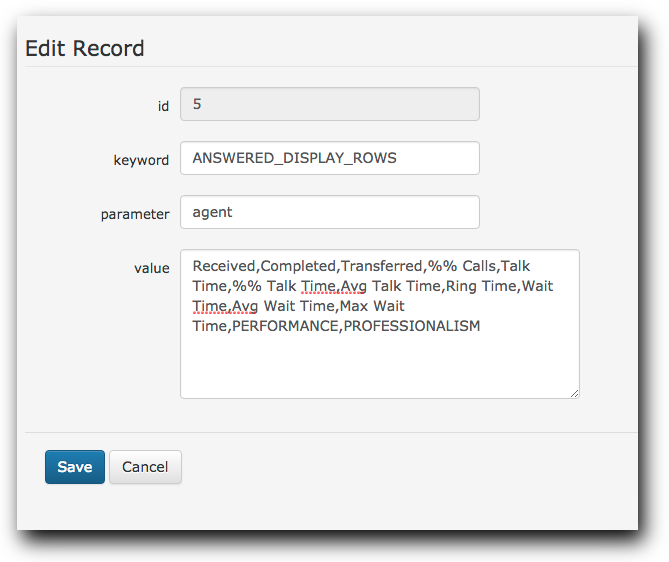
Note than in value you have a comma separated list of fields. Those fields are the one defined in COLUMN_ANSWERED, referenced by the parameter field on them. We just add PERFORMANCE and PROFESSIONALISM on the list.
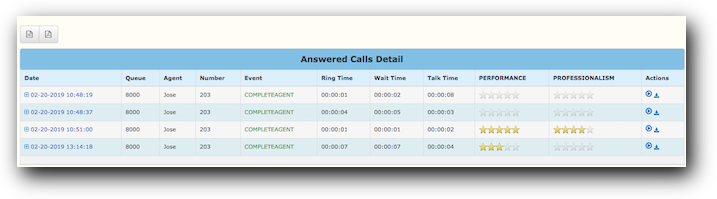
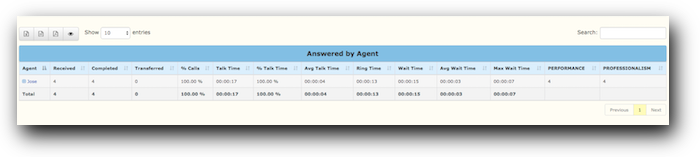
We have just added two new columns with data from our survey into Answered by Agent reports. You can do the same to add the fields to other reports at will. Here is how a report will look after adding these columns:
You might also want to have a new category/report to group calls based on actual survey answers. This is simple to do from Asternic 2.2.6 and onwards, and just a bit more complicated on previous versions as they will require to create a new .php file based on the answered_calls_by_custom.php file. This tutorial will focus on version 2.2.6 only.
For adding a new report to the Answered tabs, in report designer edit the entry "answered_reports", search for it and modify it to add our new custom reports to it:
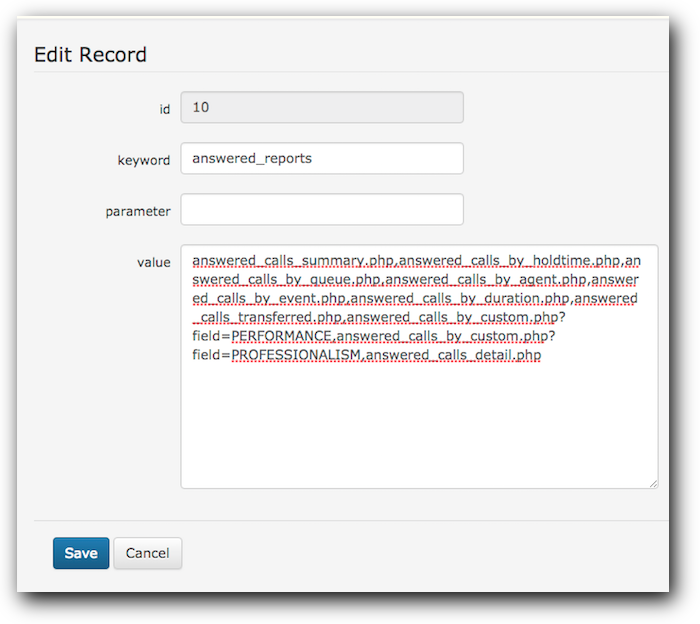
As you see, in value there is a comma delimited list of reports to show, those are straight .php files present on the system. As we are dealing with custom reports, we add near the end a couple of new reports:
answered_calls_by_custom.php?field=PERFORMANCE
and
answered_calls_by_custom.php?field=PROFESSIONALISM
Note that we must leave the detailed report as the last entry. This is a design restriction on report rendering, so be sure to add your custom reports BEFORE the _detail.php one on that category.
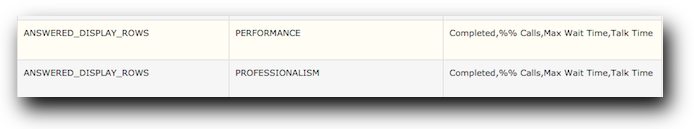
After Saving the entry, if you run reports, you will notice two new reports in the Answer tab. Those reports will be raw, they will show every column defined in ANSWERED_COLUMN. You might want to use just a handful of those to make it more readable and useful. For doing so you will need to add an entry ANSWERED_DISLPLAY_ROWS, like the one we modified for "agent" reports, but this time you want to do it for PERFORMANCE and PROFESSIONALISM. So, create two new entries with keyword ANSWERED_DISPLAY_ROWS, in parameter use the new field names, and in value a comma separated list of the fields you want to show, like this:
We have now a basic integration and custom reports using our survey data inside Asternic! But we can do more, we can add charts and change styles, continue reading to know how.
Once we have the basic data integrated, we might want to add some visual styles and charts.
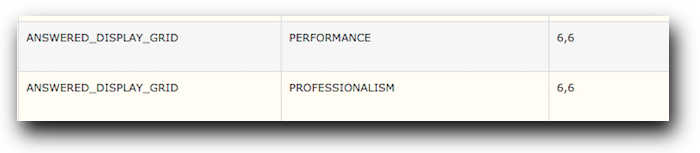
Adding charts is not that difficult, we must enter a couple of entries in designer to make charts. The first one is for showing the report and chart next to each other. Asternic uses a 12 column grid system. We must indicate how many columns to asign to the report and how many to the grid, to make it 50%/%50 we will use 7 columns for each. So, go ahead and add a couple of entries with the keyword ANSWERED_DISPLAY_GRID, the field names as parameter, and the value 6,6, as shown:
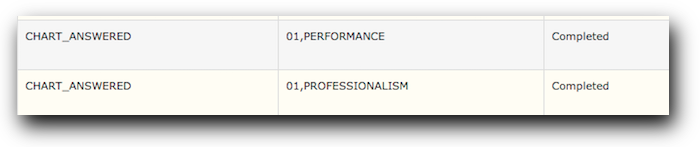
The 2nd set of parameters are for generating the charts. Is the same procedure as before but we use the CHART_ANSWERED keyword, in parameter we pass a string with 3 values separated by comma. The first value is the chart order number, the seconds value is the field to use on the x axis, and the third and optional parameter is a chart subtitle. Finally the value will contain the actual data/variable to use on the charts.
For our tutorial we won't be using a subtitle at all, and only one chart, so the order number will be 1, the field to use will be PROFESSIONALISM and PERFORMANCE, with no subtitle. As for value, we will use the Completed column that hold the number of calls that were rated on each of the possible answers. After adding the entries they will look like this on the designer:
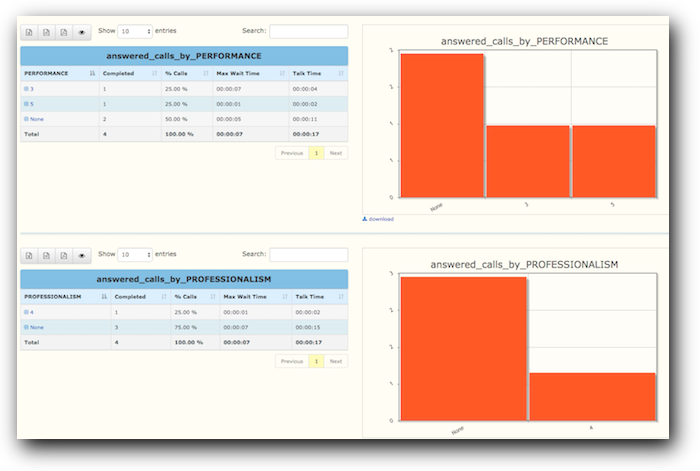
With that we finished we can run a report and look at the results:
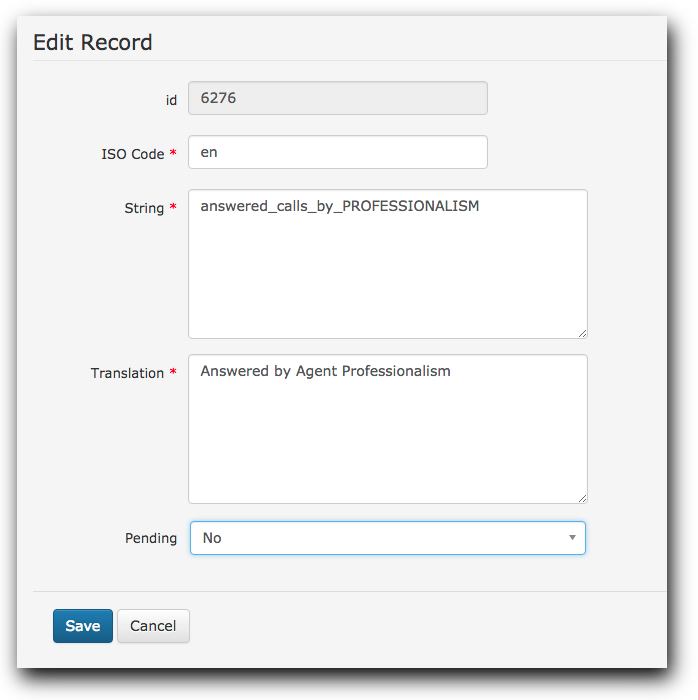
We have the option to use the Translation tool to change the name of the fields to something more friendly. Go to Setup / Translation and search for "PROFESSIONALISM"
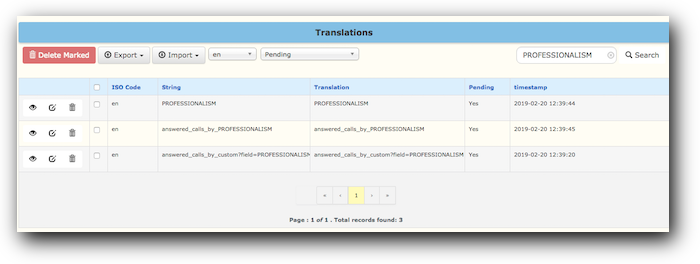
The three results we see are showing the name of the actual column in reports, the title of the custom report, and the menu option for our custom report. You should edit them and set the Translation field to whatever you want to display instead. For example, to change the report name, edit answered_calls_by_PROFESSIONALISM, like this:
There is another feature we can use to improve how reports look like: change the column format via the keyword COLUMN_ANSWERED_FORMAT in the Report Designer. Asternic comes with a set of custom functions that you can modify or create your owns by editing the file /var/www/html/stats/custom.php. We will be using for this survey an existing function called test_format, so, add two entries in report designer like this:
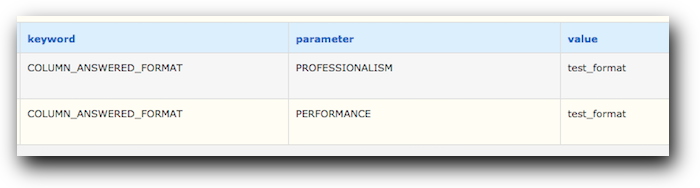
This will render the values in report columns with a nice start rating graph, like this:
You are free to alter custom.php to add your own functions for formatting, or to customize other reports using the information provided in this tutorial.
Happy customizations!